Behaviour of the potential function over the field


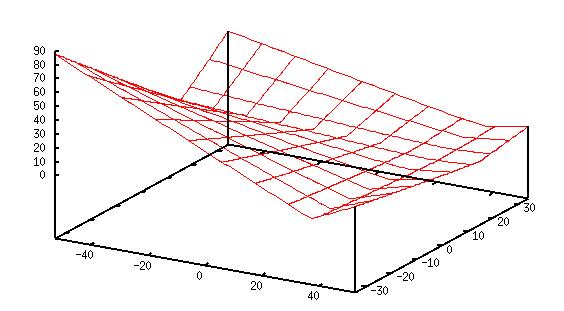
Fig 1:This is the potential fuction of a empty field for a player who has to score  towards
right.Note how the potential function increases towards the opponent's goal and drops
sharply at the boundaries encouraging the player to move towards the opponent's goal
and also to stay within the field.


Fig 2:This is the potential function of a field with players situated at (48,6), (37,15), (30,20), (32,1).The field boundary and the opponent's goal and offside  have not been taken into account.Note how the potential drops near those points thereby forcing the passive player to move away from them.
(Only linear part of the player's contribution is shown here. In the actual function, there is a small negative peak at each player's location)


Fig 3:this shows the potential function due to the last defender at(48,6) in the
field.As it can be seen,it refrains the passive player to cross the last defender
as a subsequent pass to him would lead to offside. A very steep cliff is produced at x=48.


fig 4:This is the potential field obtained by superimposing the above three fields thus
giving the net potential field.The effect of all the above mentioned factors can be seen
in this plot clearly.The plot drops sharply at x=48 to prevent offside and at the
boundaries.It also pushes the player away from the other players in the field.

Back to main page