Principal Components Analysis - A Demonstration
From the pages of the
Aberystwyth
quantitative biology and analytical biotechnology group.


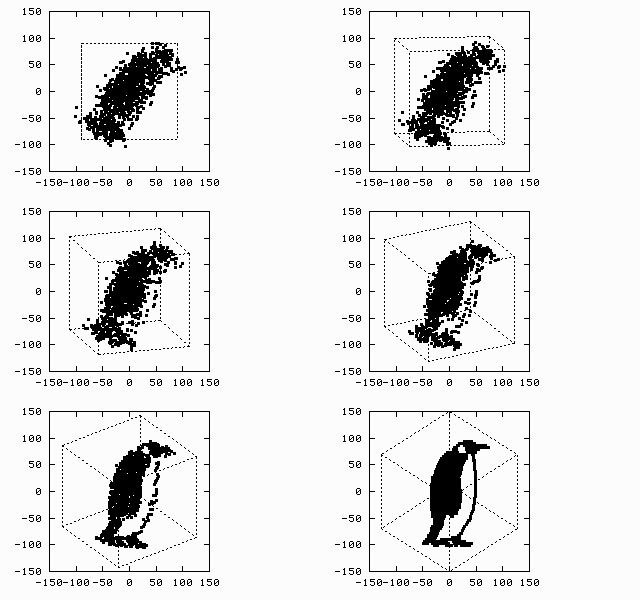
The data set consists of a cluster of values in three variables.
Plotting any two of the variables against each other doesn't show any obvious
structure. However, when we rotate the data set, we see that the set is
actually very structured. So, for a simple, 3-d set, it can be hard to see the
structure. Imagine the problem when 300 variables are being
used!
Principal components analysis provides a method for finding structure in
such data sets. Put simply, it rotates the data into a new set of axes, such
that the first few axes reflect most of the variations within the data. By
plotting the data on these axes, we can spot major underlying structures
automatically. The value of each point, when rotated to a given axis, is
called the principal component value.
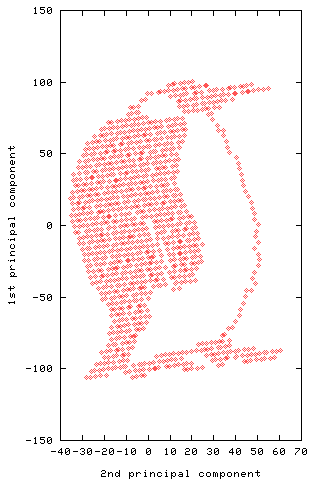
For example, the plot alongside shows the first two principal components of the
data set used in the animation.
Back to the Report Page

