k = 6
Codes
Part-A
1.(a)
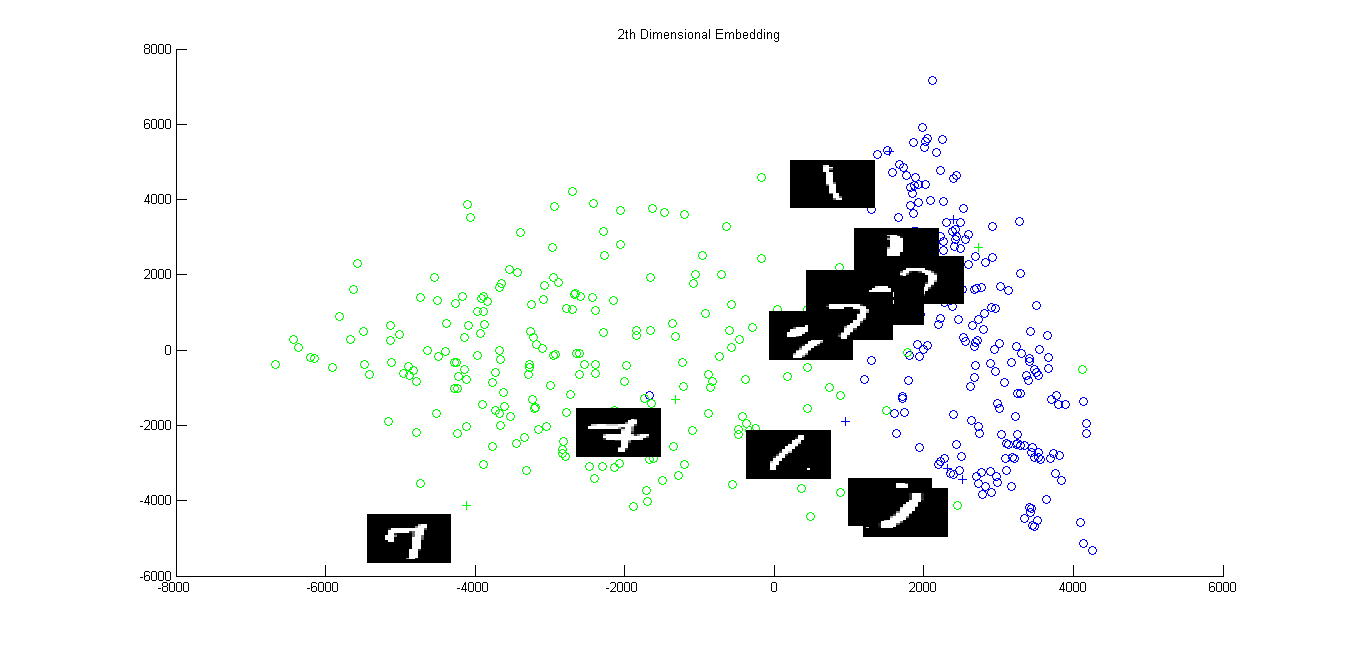
The clusters of 1 and 7 are shown in Blue and Green, repectively. '+' denotes the points of which image of label are shown (slightly below and towards left).
1.(b)
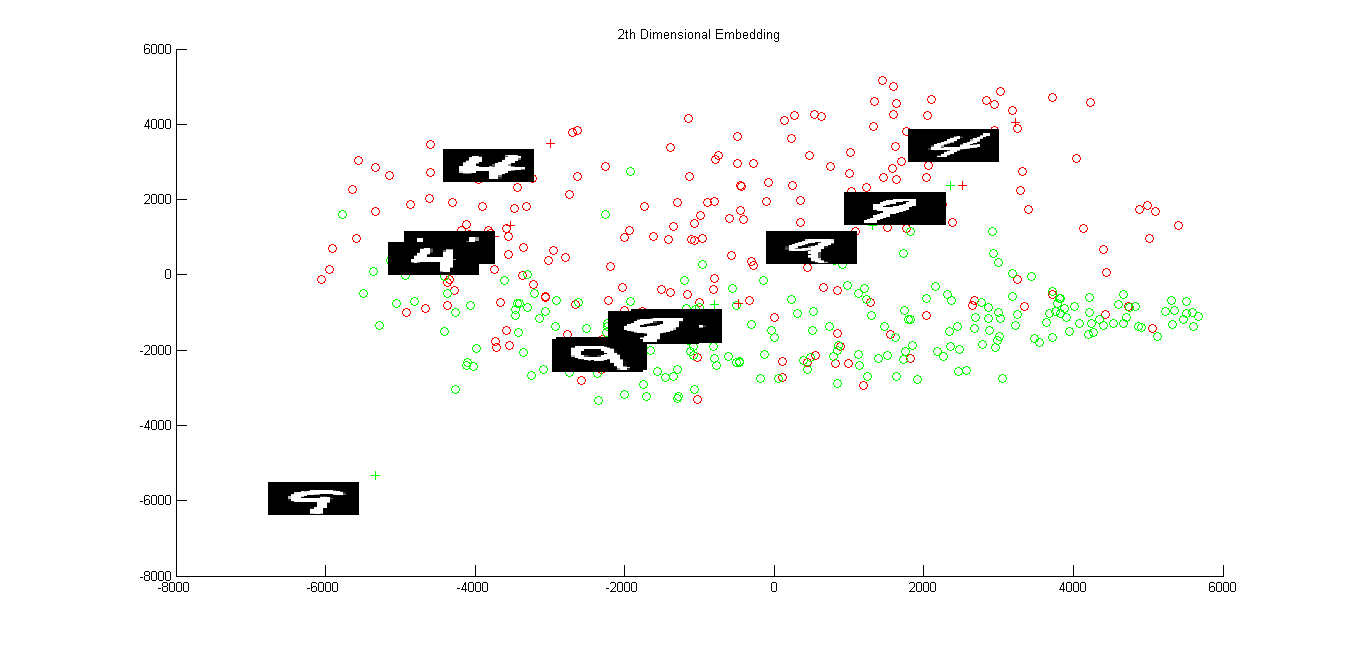
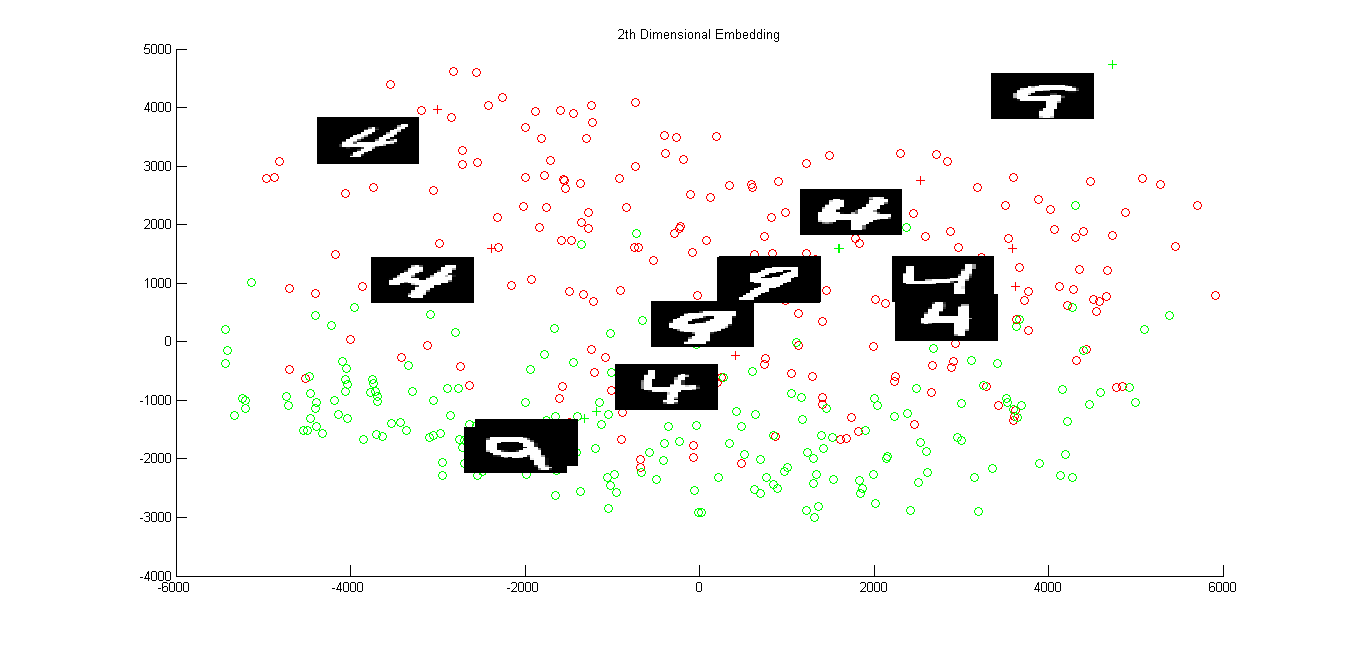
The clusters of 4 and 9 are shown in Red and Green, repectively. '+' denotes the points of which image of label are shown (slightly below and towards left). We can see that clusters of 4 and 9 overlap slightly when isomap is applied on the Euclidean distance.
1.(c)
Following is the index for the above figure-
0 - o ; 1 - o ; 2 - x ; 3 - o ; 4 - x ; 5 - + ; 6 - x ; 7 - o ; 8 - + ; 9 - x
2.(a)
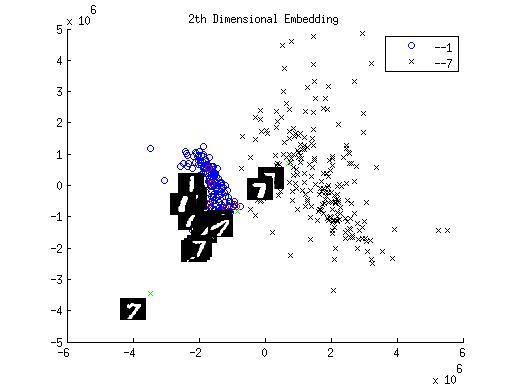
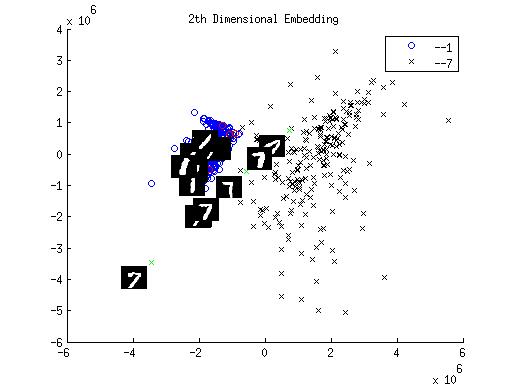
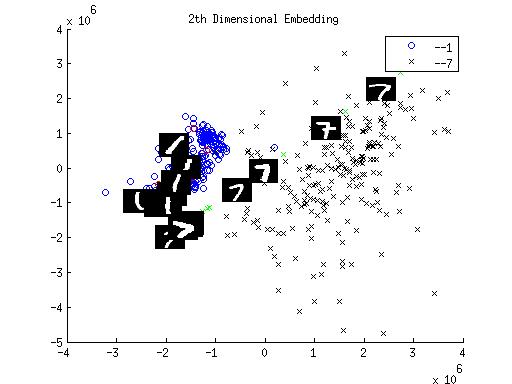
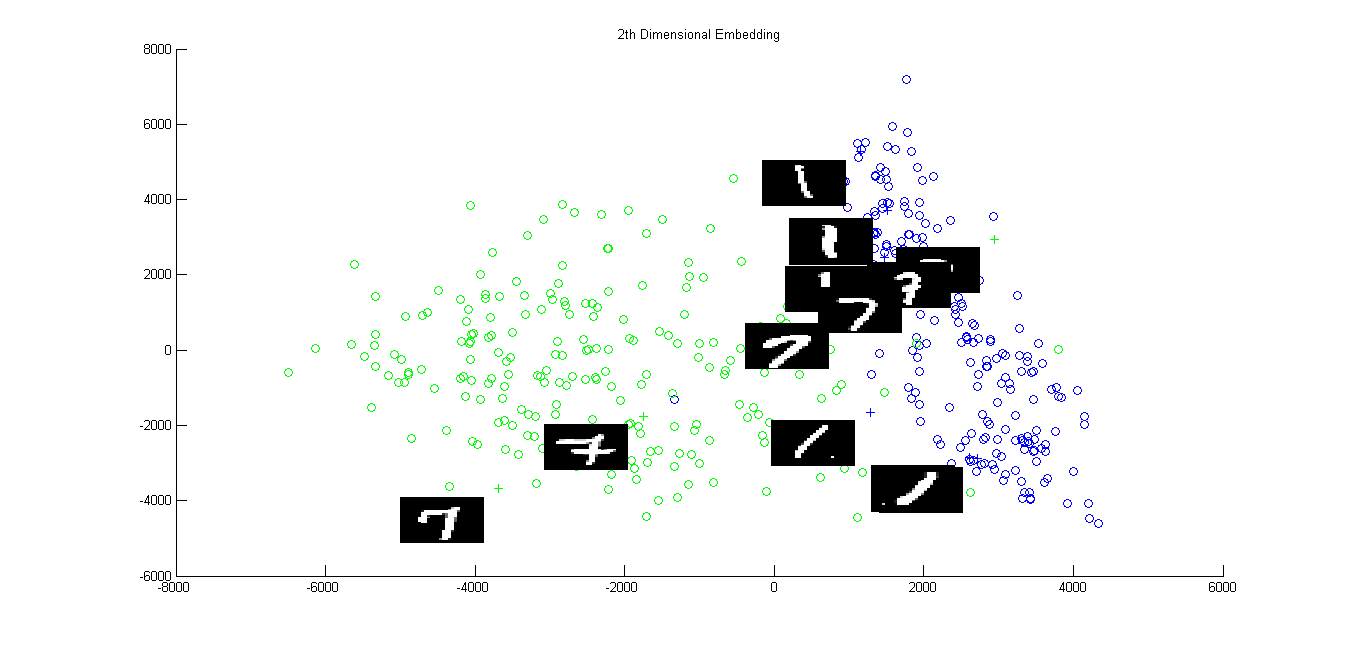
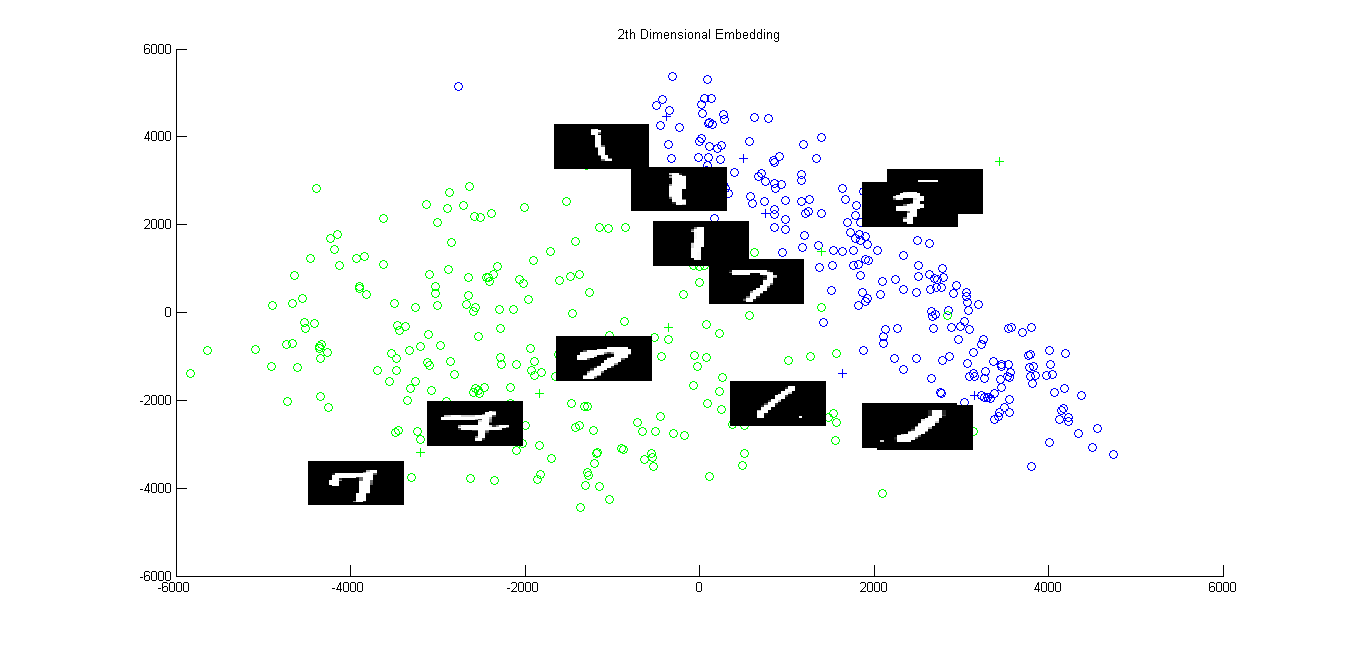
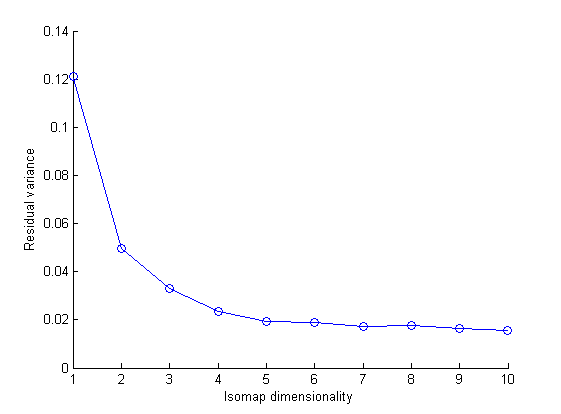
Above is the Isomap plot of the digits with labels 1 and 7 together and residual variance of this data. All displayed 1's are red circles, rest of 1's are blue circles while all displayed 7's are green cross and rest are black cross. All the three plots are using 'k' parameter in isomap calculation of image data with the k = 6,7,10 respectively. The dimensionality after isomap reduction of dimension in the given data is not constant for lower dimensions. The Isomap data of the digits 1 and 7 is quite seperate as seen in the image for all the displayed value of k.
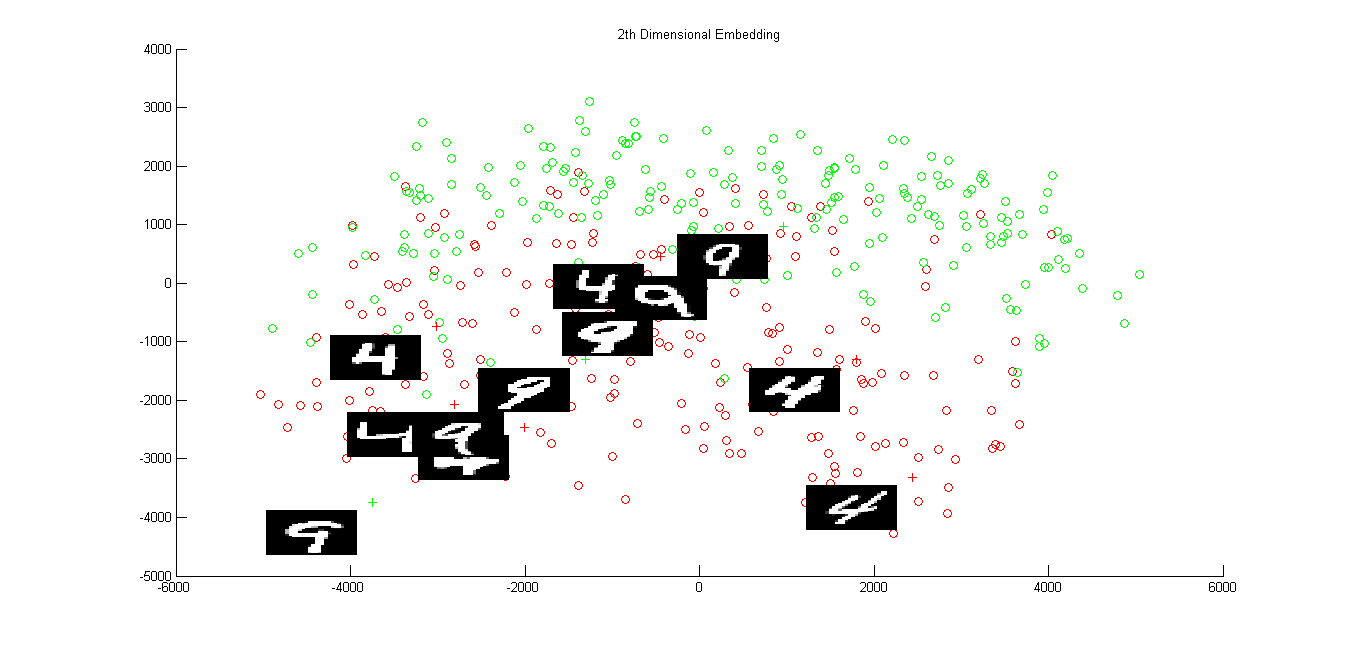
2.(b)
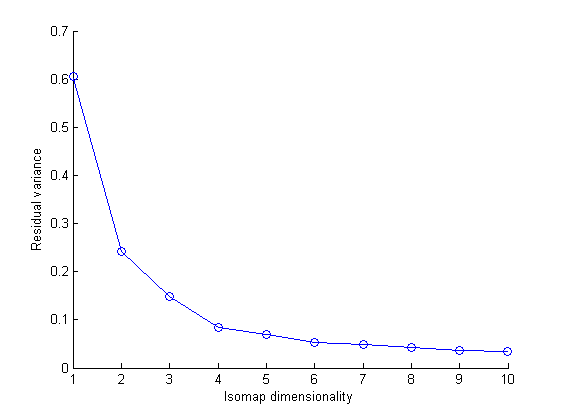
Above is the Isomap plot of the digits with labels 4 and 9 together and residual variance of this data. All displayed 4's are red circles rest of 4's are blue circles while all displayed 9's are green cross and rest are black cross. All the three plots are using 'k' parameter in isomap calculation of image data with the k = 6,7,10 respectively. The plot of the isomap for 4 and 9 after considering tangent distance into account in calculation of isomap gives 4's and 9's seperate from each other as compared to that in the euclidean distance.
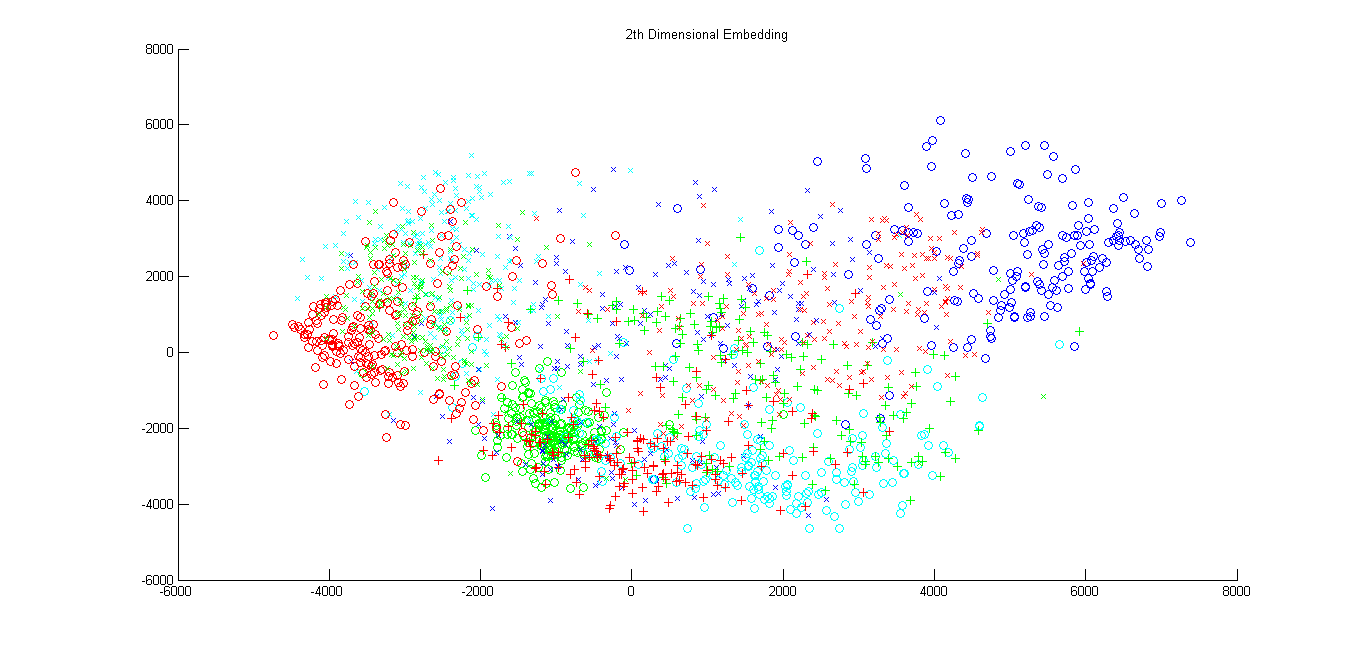
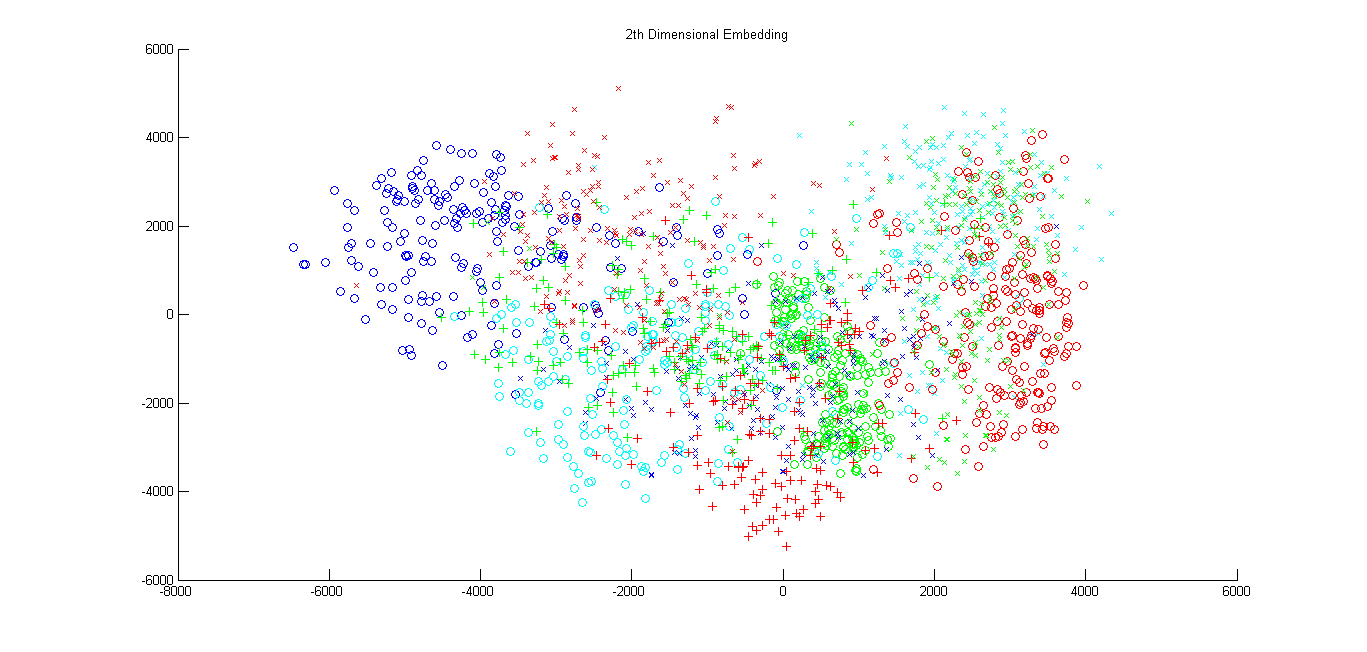
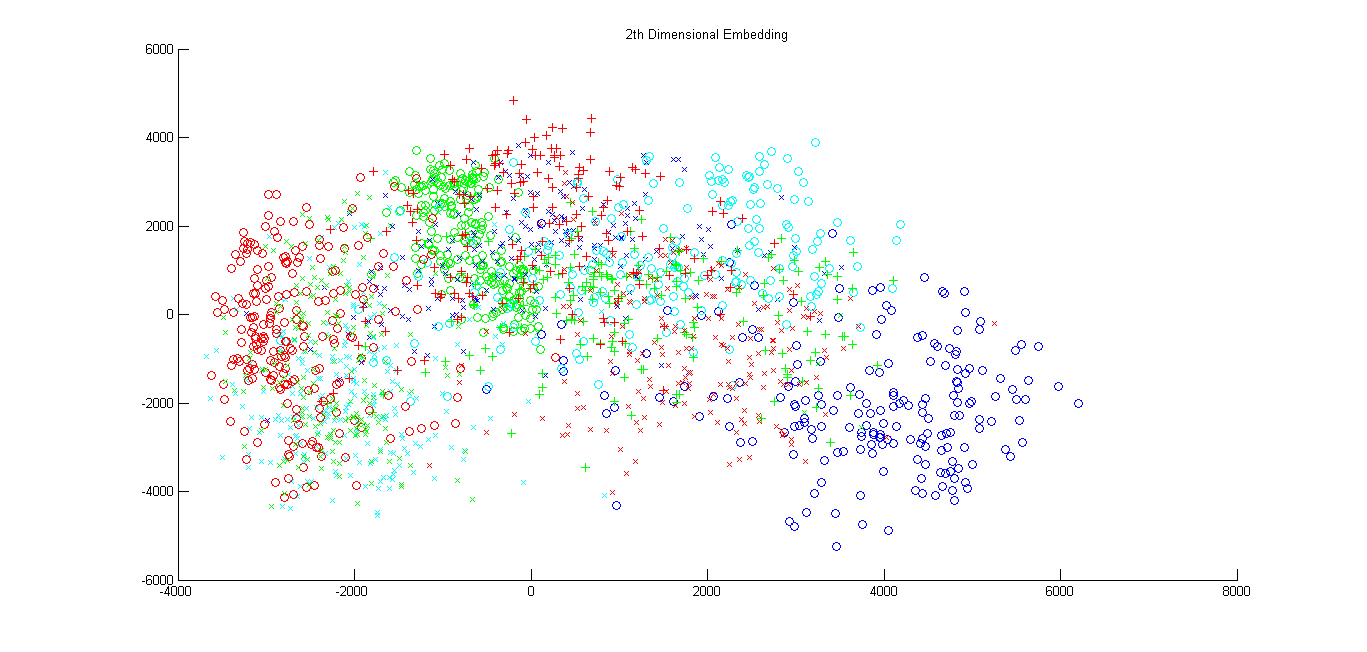
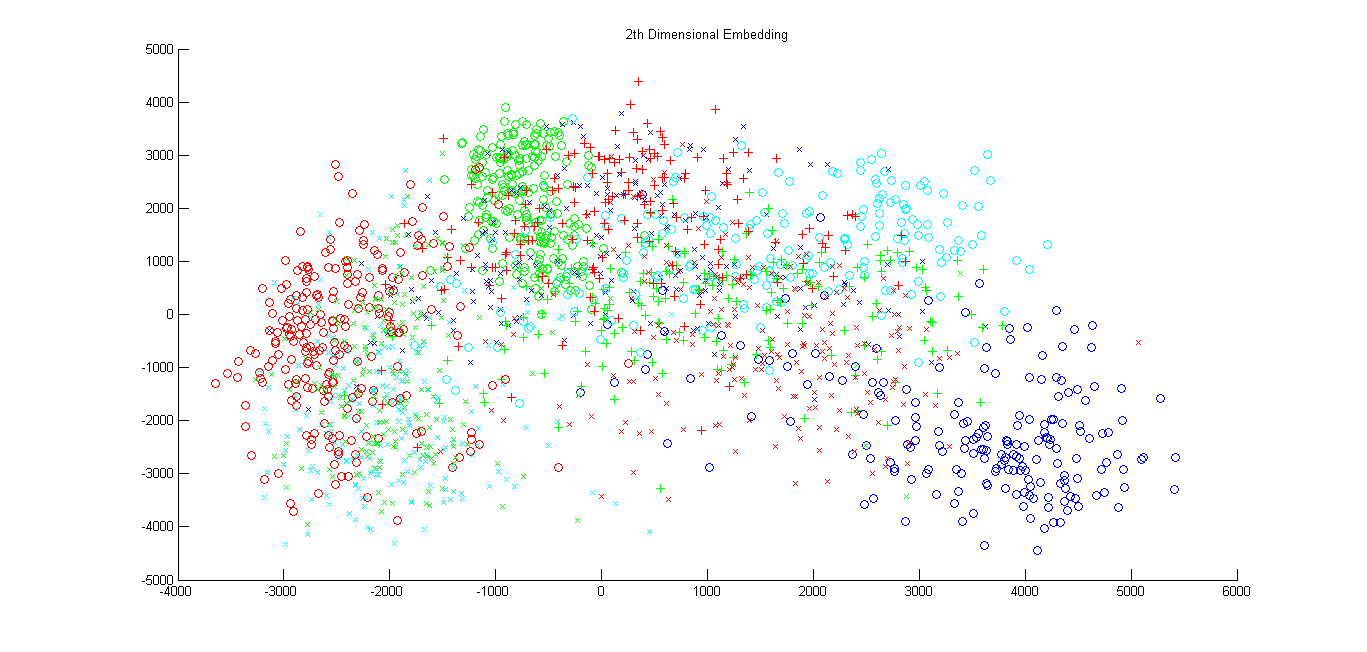
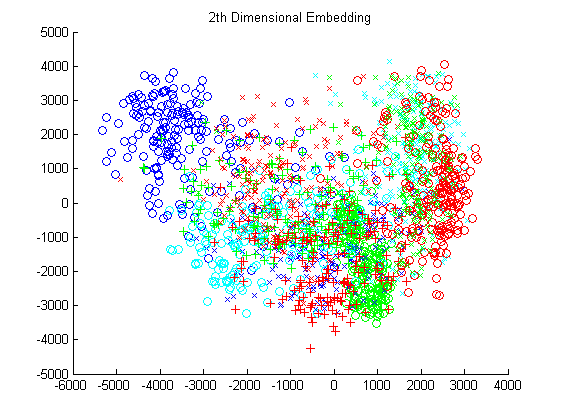
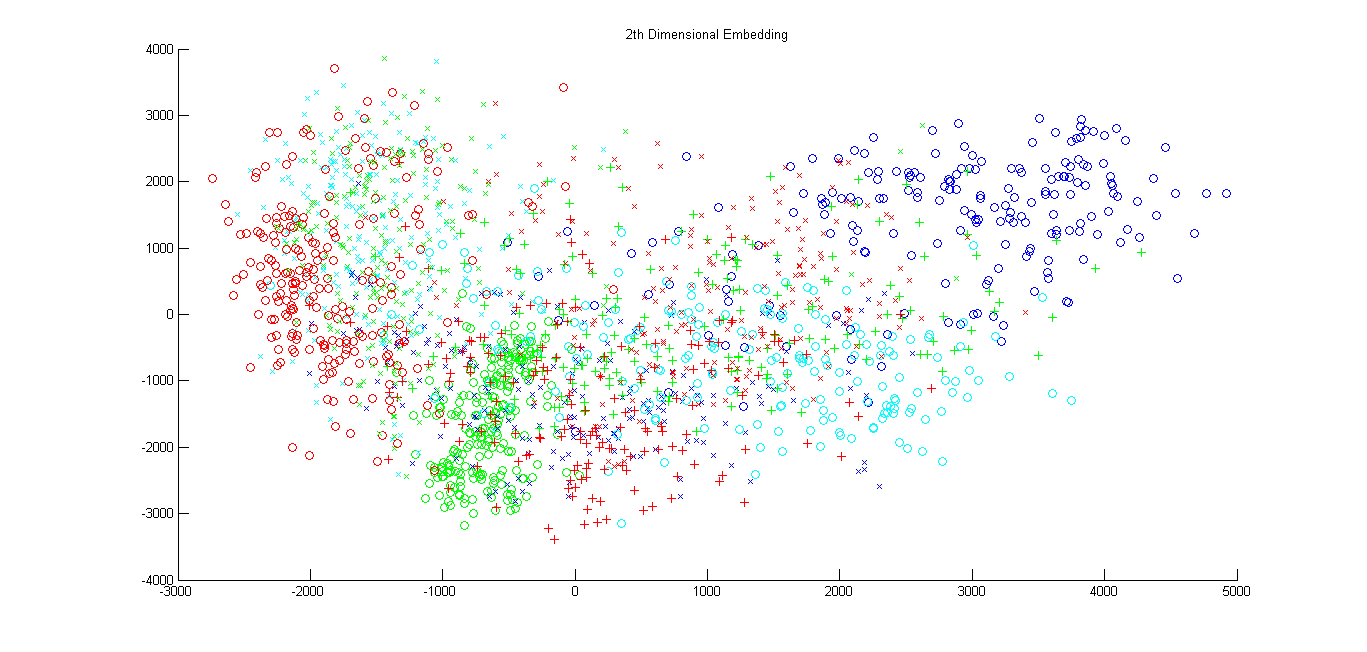
2.(c)
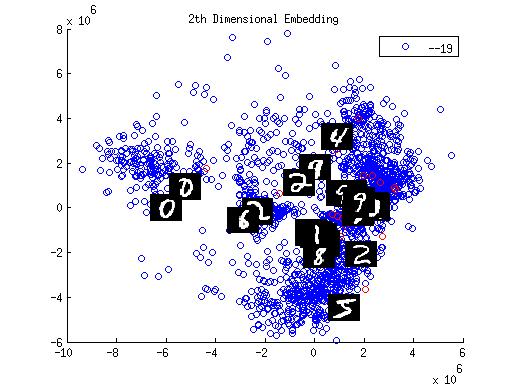
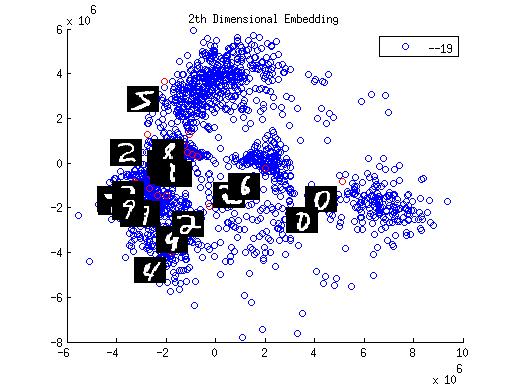
In the plot of all the numbers in one diagram using Tangent distance the 0's are well seperated clustered from other numbers. The clusters of 4's ,9's are merged as well as that of 1's, 2's and 7's are merged.
3. Click the links given below for Hindi Numerals Data.
Part-B
1.

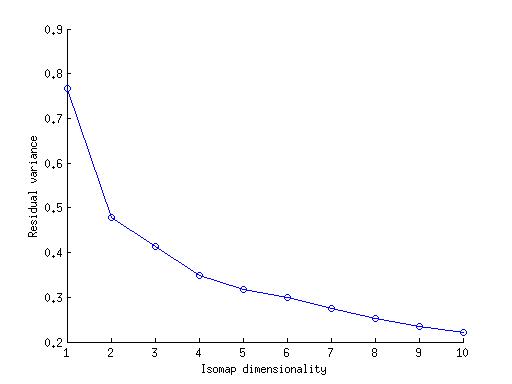
The plot of 2nd dimensional isomap of images of human robot Aldebaran Nao is as given above using different valuse of k.
For k=6 The dimensionality of the data as observed from the residual variance graph is 2. In this case there are three connected components in the intermediate neighbourhood graph. And largest connected component is subgraph with 146 points. The value 2 is because while taking(k=7) we get isomap for only 2D(in the plane of image).
For k = 40 the estimated and much possible value of dimensionality is 3. The extra dimension emerged is due to the reason that both the robot and the camera are fixed, only arm is moving.So there is a motion of arm in third dimension(perpendicular to the image plane).
For k = 26 we get single neighbourhood graph but now residual variance curve shows the dimensionality of 4. This dimensionality can be explained on the amount of light falling on the robot and reflecting from it's arms. When the arm moves, it creates blocks some light falling on robot. As the arm is moving the licht reflected towards the camera from arms is changing also.
Therefore if we consider lower number of neighbours in for isomap creation then some points are left isolated therefore graph has two or more connected components.
2.
The above plot is for two pair of arms freely moving. The residual variance graph of the arms in RGB value shows dimensionality of 4,which is because the two pair of arms have four degree of rotation. If we take the grayscale images for isomap creation than we get dimensionality of 2 from residual variance curve.
3.
4.
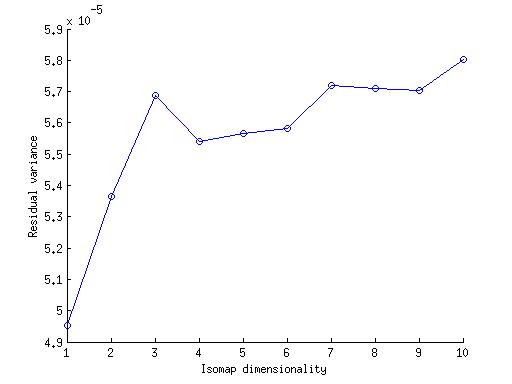
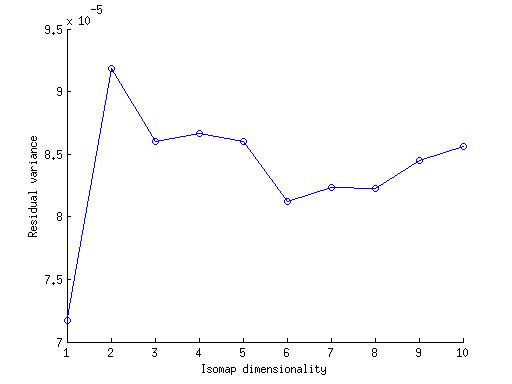
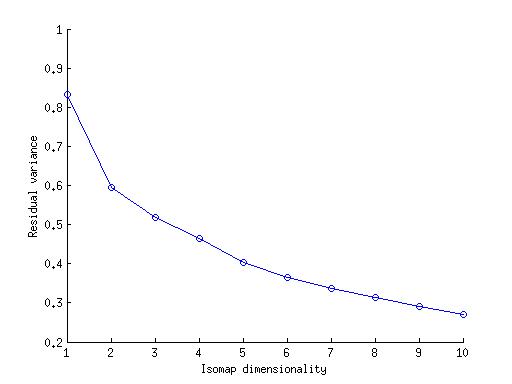
The above figure is for two pair of arms moving a box horizontly.We can estimate the dimensionality of the image data from the residual variance curves for lower k. For k=4 and 5 it is 2. But the residual variance of of the isomap is of the order 10^(-5) which is a very small amount. Therefore we can say that the dimensionality of the data is 1. In the question B(2) the arms can rotate freely for(01,02,03 and 04 are independent from each other), so the dimensionality of that image data is 4 while in this question if we fix one angle then all the other angles are fixed, so the dimensionality of the image-data should be 1.