Storytelling Science
Rich man, Poor man
Amitabha Mukerjee
It is morning and my train to Calcutta is stopped at a village called Galsi. Outside the tinted windows of my AC coach, I see thatched roofs over brick walls, a teashop, and a cycle shop with lots of commuter bicycles outside.I wonder about the the wide gulf between the lives of people. Here I am, ensconced in air-conditioned comfort, being served breakfast by the uniformed waiters of Rajdhani express - and outside the villagers can barely eke a living. But there is disparity even among them. Bicycling along comes an office babu, his tiffin strapped to the rear carrier - probably among the top earners in the village. And then the mother in dirty brown sari, bedraggled daughter in tow, scrambling into the ditch with woven reed baskets on their matted-hair heads, gathering cowdung. For the price of my breakfast, they could run their household for many days.
The condition of organisms on earth is intrinsically unequal. But how can we measure inequity in societies? In one argument, this inequality is what leads to progress, but how much of it can we tolerate?
Measuring Inequity in Societies
How to measure inequities? The economist Corrado Gini proposed a measure. If everyone is equally well-off, the Gini index is zero. If the richest person has everything and everyone else has nothing then the Gini Index is 100. India's Gini Index is 37.8; Hungary and Japan have the lowest (about 25), and Brazil is among the highest (60).
To get a feel for how the Gini Index is measured, consider four friends playing marbles - Abhay, Billoo, Chikku, and Danab - with (1,2,3,4) marbles respectively. Now, let us plot the number of marbles owned by the poorest fraction - a point (x,y) on the curve indicates that the bottom x% of the population own y% of its resources. If everyone was equally rich, then this line would be a straight line (every person raises it by the same amount).
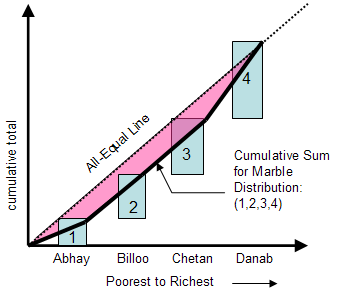
The Gini index looks at the shaded area between the all-equal line and the cumulative-sum curve. In perfect equality, this area is zero. In perfect inequality, everyone has zero except the richest, so this area is the whole triangle under the line, 100%. For our marble players, this cumulative-sum area is 15 and the area under the triangle is 20, so the ratio is (20-15)÷20 or 25%. [Storytelling Idea: Have your kids cut straws of length 1,3,6 and 10.] In our group of boys, the bottom 25% (Abhay) has 1 marble, 50% have three marbles, 75% have six and all 100% have ten. So our cumulative-sum curve is running beneath the all-equal line (in fact this distribution has a Gini index of 25, about the same as Japan). The more the area between this cumulative sum and the all-equal line, the higher the disparity. The Gini index is the percentage ratio of this area divided by the triangular area under thea line.
To understand Brazil's situation, consider a marble distribution with Gini Index 60: (0,1,1,8). With 80% of the wealth in the top quartile, the native tribals of the Amazon and its other poor get very little indeed. India's situation may be something like (1,1,2,6) which has a score of 40, (also the index for USA). The high wealth at the top is reflected in the fact that nine of the world's 500 richest people are from India.
The Capitalist Debate: What's so good about Inequity?
In the face of this inequity, should the government tax the rich and help the poor?Let us look at our our four friends to explore this economic theory. Assume that Billoo has been practicing marbles, and that he wins two marbles from someone else. Then the group's total goes up to 12, distributed (1,3,4,4), Gini index 20.8.
But now we have another problem. Poor Abhay is sad and he comes home crying. His is an influential family, and when the mothers meet at a birthday party, they discuss it. Let's say the mothers get Billoo and Danab to give one marble each to Abhay (hmmmmm??). Billoo grumbles heavily, but now everyone has three marbles. However, after this, Billoo loses his zest for acquiring marbles, for it is futile if he has to keep giving them away! The group as a whole does not raise its marble count any further.
Economists argue about two effects of inequality:
So a society must reward hard work, but not to the extent that a small fraction owns too much of its wealth.
- The Incentive Effect. As in this story, if inequality vanishes, e.g. by taxing the poor and paying the rich, then people have less incentive to work hard.
- The Distancing Effect. Inequality perpetuates itself: the poorer you are, the harder it is to catch up. Consider the education your maid's child is getting.
Even as I write this, the Rajdhani Express has moved far from dusty Galsi and its problems. Calcutta beckons, and I find myself wondering if the communist leaders of this state travel air-conditioned class.