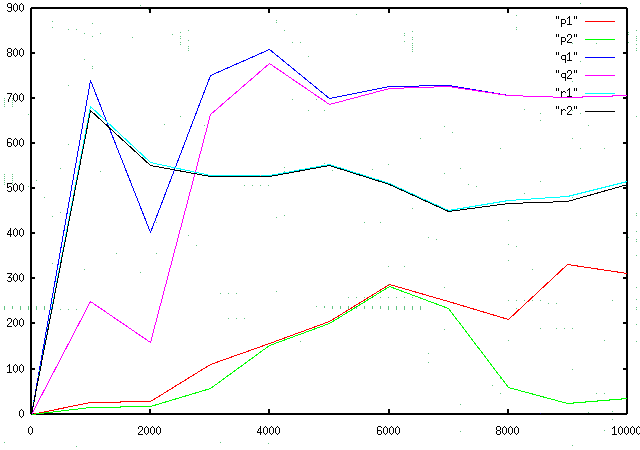
-
This plot shows the performance of learning algorithm for 1 serve over
10,000 trials
-
Here weights have been dumped and loaded in the successive run to tune
the net
-
The number of iterations here are 3
-
The blue and pink lines are the final curves in the 3rd iteration.
-
The red and green lines are in the first iteration
-
Plota where
-
a=1 refers to successful shots => reaching the ball
-
a=2 refers to completely successful shots => hitting
a correct shot as well
-
Here
-
Gamma = 0.9
-
Lambda = 0.95
-
Reward Function = 2 for complete
success
= 1 for partial success
= -1 for failure
= 0 otherwise
