Bicycling science
Frank Rowland Whitt and David Gordon Wilson
Whitt, Frank Rowland; David Gordon Wilson;
Bicycling science
MIT Press, 1982 (2nd edn), 377 pages
ISBN 0262731541, 9780262731546
topics: | bicycling | physics | aerodynamics
A fascinating work.  A must read for all technically minded
cyclists.

from Preface: Frank Whitt, who had initiated the idea and gave Wilson
the ms in 1969.  The first edition was published in 1974 and became an
unexpected success.  Just as the 2nd edn was entering printing in 1981,
Whitt went into a coma and eventually died.

Some parts of this review are from The third edition, which has
authorship by David Wilson alone.
How to compute your friction
Nearly ALL your bicycling energy goes in overcoming two kinds of friction:
    - aerodynamic drag (increases exponentially with speed)
    - rolling friction (fairly independent of speed)

(there is also some loss in transmitting power from the pedals to the
rear wheel - frame flex, chain stretch, bearing friction, but this is
very small in most modern bike designs.  But the stiffer the bike, the
less the frame flex - and the more the road shock at your butt.]
Rolling friction
More than slickness, rolling friction is caused primarily by the flexing of
the tire rubber which converts your effort into heat.  the bumps on the tire
also affect it, but the flexion is much less.

What contributes to rolling resistance is side-wall thickness - every time it
compresses and decompresses, some amount of heat is generated.  That's why
better tires have thinner sidewalls.  The tradeoff is that thinner walls ==>
worse puncture resistance.  A compromise is to build a lot of thin fibers in
the sidewall, which flex more elastically, but are more expensive to make.
The better roadie tires all have fiber of some kind, so the matrix (which
does the flexing) is very thin.

drag due to Rolling Friction = cR. mg; cR = 0.002 (.2%) for slick tires at HP
on smooth roads. as much as 0.008 for utility tires at low pressure.

Slick vs non-slick: also, a truly smooth tire surface can be downright
  dangerous in even a little wet patch - at least a few recessed grooves are
  essential to channelize water and prevent slipping (hydroplaning) on wet
  patches.

Tire pressure: Pressures lower than 40 psi can seriously degrade
  performance, but pressures higher than 80psi have little effect.
Aerodynamic drag
At the speeds most of us would like to travel at, aerodynamic drag is the biggest enemy. drag force = cD x dynamic pressure of air x frontal area where dyn pressure ~= air density x (rel.velocity)² at speeds < 150kmph. cD: aerodynamic drag coefficient cD depends on the flow: - laminar - lowest. - turbulent (small eddies) much higher. - separated (large unconfined eddies) - highest. cD is the lowest if the laminar flow can remain attached (does not separate from the surface). the downstream flow on the back of an aerofoil gives some pressure recovery resulting in a forward pushing force to counteract the drag at the frontal surface. but attached flow is very difficult. separation results in large eddies with high kinetic energy dissipation, and is worse than turbulent flow. hence the goal for bicycle design is small-eddy turbulent flow, rather than laminar. turbulent flow, if it does not separate, is much less drag than laminar with separation. thus, it is better is to "trip" the can be induced to separate, as was observed by Prandtl in his classic experiment with a sphere, which had much lower drag with a trip wire than without. same principle used in golf balls. For a "bluff" body that is not streamlined (like a sphere or a bicyclist) - resistance is high for when the layer of air next to the body flows smoothly (at Reynolds num below 4 x 10⁵). This results in "separated flow" that creates a bigger gap (vacuum) at the back. The drag may be much reduced if the flow is small-eddy turbulent. Turbulence arises at higher speeds, but the transition can be induced at lower speeds by increasing surface roughness, as in a dimpling a golf ball. Thus, a smooth golf ball hit at 75 m/s has a RN 2 x 10⁵ - which is in the laminar flow region and has a high drag. By dimpling it, the transition point is lowered and now it is turbulent at lower speeds, - actually the leading edge of the transition moves forward - and the drag coeff may drop by a factor of 4 to 5 (0.47 to 0.10). [p.89]flow profiles at different speeds (Reynolds Num). drag coefficient cD as a function of reynold's number. The "transition points" are situations where the flow pattern changes. (image from http://www.thermopedia.com/content/707/) Reynold's number is a dimensionless quantity that tells you many aspects of fluid flow. For a spherical shape, it is equal to: (relative vel x sphere dia x ( air density / viscosity) air density / viscosity is about 10⁵ MKS at sea level 19 deg C.
Drag coefficient : road vs mountain geometry...
drag coeff : based on reynold's number
at Reyn num ~ 3 x 10⁵, turbulent flow, but
RN for spokes ~ 10^ 3-4; frame = 10^ 4-5; human body = 10^ 5-6
--> also area is highest on body; so most of the drag is due to body
For bicyclist going upright - modeled as cylinder - 600 mm dia at 5m/s;
RN = 2x10⁵
--> below the transition point (4x10⁵)
As RN goes up, the point of transition from laminar to turbulent moves
upwards towards the leading edge.
cD for bicyclists - about 0.9 in racing clothes [Nonweiler] - with avg frontal area
(mostly bicycle) - about 0.33m² for crouch, and 0.5m² for touring.
[AM: this area difference alone amounts to a 50% higher drag when you are
sitting upright... ]
for a bicyclist w cD of 0.9
drag force = 0.54 x frontal area (m²) x speed² (m/s)
And here is a chart that shows how effective frontal area and
drag coeff. reduces for different geometries.
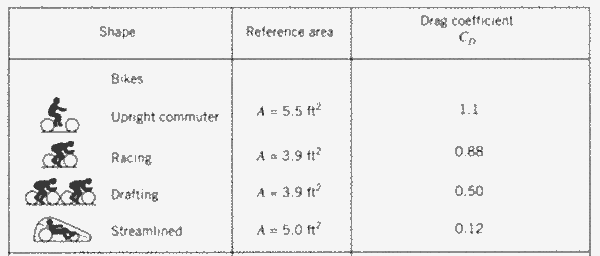 figure modified based on image at
http://www.chegg.com/homework-help/questions-and-answers/two-bicycle-racers-ride-30-km-hr-still-air-percentage-power-required-overcome-aerodynamic--q1814665
figure modified based on image at
http://www.chegg.com/homework-help/questions-and-answers/two-bicycle-racers-ride-30-km-hr-still-air-percentage-power-required-overcome-aerodynamic--q1814665
cD for other shapes
        aerofoil     : 0.1
        sports car   : 0.2-0.3
        sedan car    : 0.4-0.5
        sphere       : 0.47
        bus          : 0.6-0.8
        cylinder     : 0.7-1.3
        truck        : 0.8-1.0
        racing cycle : 0.9
        sqr plate    : 1.2
        motorcyclist : 1.8


[the following section not from the book]
Percentage equivalent energy
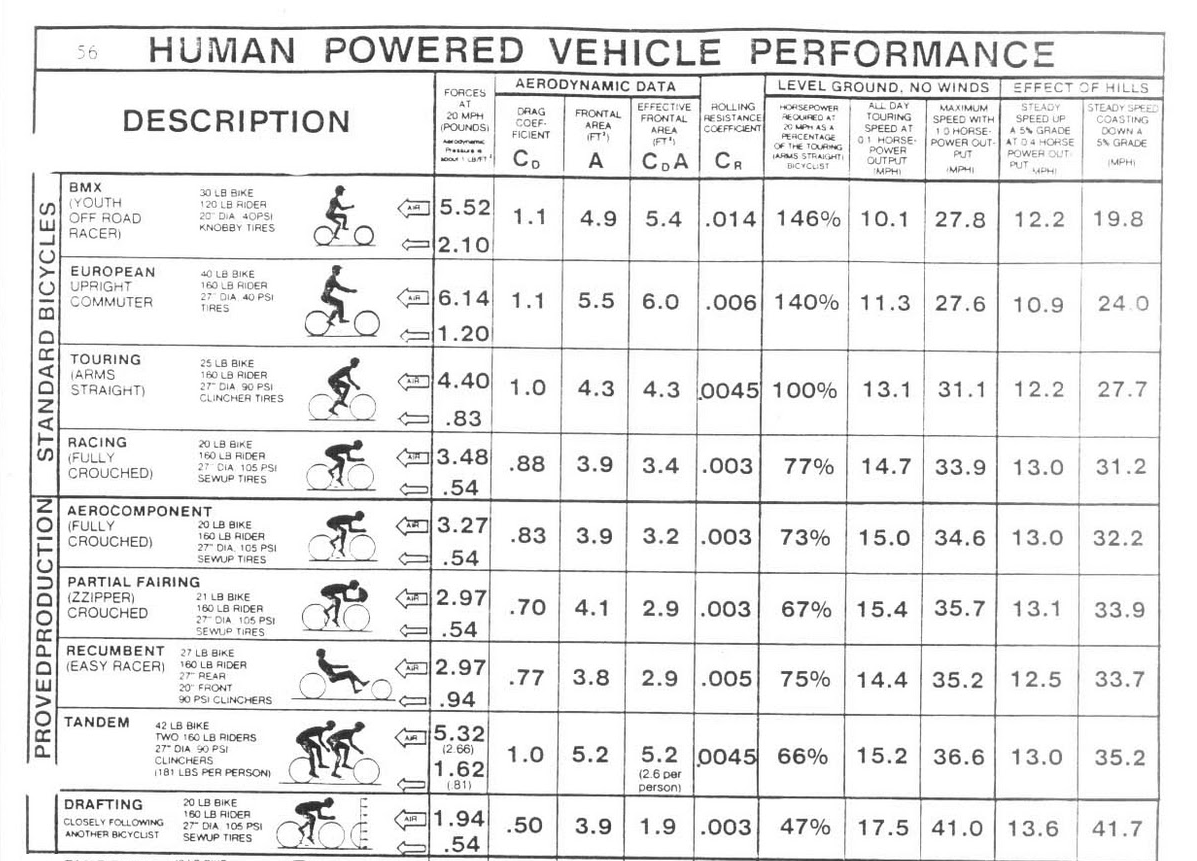
Here is a more detailed chart of the various factors affecting drag, from the article "The Aerodynamics of Human-Powered Land Vehicles", by Albert Gross, Chester Kyle and Douglas Malewicki, Scientific American 1983. Chester Kyle (see below) was one of the pioneers of fairing design and for many years his designs maintained the HPV land record.(image cropped from http://cozybeehive.blogspot.in/2011/01/aerodynamic-drag-chart-for-human.html.) [Click and enlarge to read the headings] A quick summary: If the same rider (75kg) on a road bike frame (10kg) expends 100 watts energy on a 20kph ride, he would take about 140W for the same speed ride on a city bike frame, and about 1.3P on a hybrid bike frame. (Most of the gain arises due to difference in posture, which reduces the frontal area.) The world distance covered records for a one hour ride from start are about 56 km for race bikes (UCI), and about 92 km for HPVs (with fairing).
Recumbents
The Velocar (1930s), reduced the frontal area by almost 20
percent. With it a relatively unknown rider broke most existing
short-distance track records and beat the reigning world champion. The
governing body of cycle racing outlawed the recumbent bicycle before it
could do any more damage to existing reputations.

In 1974 a series of speed trials and races started by Chester Kyle
(IHPVA) in CA, USA.  Riders' top speeds increased from about 30 to
about 36 mph ... drag coefficients of the casings were about 0.25. More
recent intensive work by Kyle and competitors in the IHPVA trials has
led to enclosures with drag coefficients in the region of 0.1 (based on
NACA wing profile 0020).  Also, length-to-thickness "fineness" ratio of
4 or more to avoid boundary-layer separation.

In 2004, the HPV record speed was 35m/s².
World record HPV speed
GOLD RUSH:
The world hour record is at present 73 km/h (September 1989). Both records
are held by the vehicle "Gold Rush", built by Gardner Martin, with Fred
Markham ("Fast Freddy") as rider. Gold Rush has very good aerodynamics: an
effective frontal area of 0.046 m2
http://www.sheldonbrown.com/rinard/aero/aerodynamics.htm

[As of 2013, the record is held by a Dutch team is 133.8 kmph,
for the last 200m after a 8km run-up]

Here's a video of their "bike" going at > 130 kmph:


more at: http://www.bikeradar.com/road/news/article/world-human-powered-vehicle-speed-record-upped-to-83-13mph-38440/
Bottom line: flat terrains
[These are largely my own analysis]

On level ground, the pedaling energy goes to overcome two factors:
   a) wind resistance, given by drag coeff (cD) x frontal area
	x speed-squared
   b) rolling resistance, given by rolling-ressitance-coefficient (cRR)
	   x weight, where weight is kgs x 9.8m/s2.

On flat terrains, - the cD for most bikes is around 0.9, and a roadie
high-thread-count thin-wall tire will have a cRR of 0.0025, at 5atm (80psi),
say.  At about 22kmph (6m/s), bike+rider weighing 85kg,
then with a crouched posture your frontal area is about 0.33m². Then
the energy you need is:

    overcoming wind resistance: 0.9 x 0.33 x 36  = 10.7 Watts
    for rolling resistance:     0.0025 x 85 x 9.8 =  2.1 Watts

So you'll need 12.8w, of which rolling resistance contributes
about 16%.  At 25kmph (7m/s), it is 12% of the total, and
at 18kmph (5m/s) it is 22%.

Now, if you have wider tires but they are well-inflated and worn
smooth your cRR may go up to 0.0035.  If you have thick sidewalls
and big lugs, your cRR may be as much as 0.005.  But a much more
pronounced effect is seen if your tire pressure is below 3atm
(45psi) - then you can even go to 0.008.

Let's say you are on an MTB with well-inflated, not too-luggy
tires (cRR=0.035).  Your cD is about the same, but your frontal
area is about 0.5m² (close to upright posture).  At the same 22kph:

    overcoming wind resistance: 0.9 x 0.5 x 36    = 16.2 Watts
    for rolling resistance:     0.0035 x 85 x 9.8 =  2.9 Watts

so now you are spending nearly 20 watts - about 50% more than
the roadies - but most of it is due to the upright posture.  The
rolling resistance contributes a little less - 15% - of this
total.


slopes:

On hills, gravity comes into play (gradient * weight * speed), and even on
gentle climbs, this far outweighs anything else.  Thus, while climbing, the
tire simply does not matter.  On downhill stretches on the other hand, it
is the wind resistance that dominates.
Hardest climbs
Mt Washington in NH: avg slope = 11.5% over 12.2 km
Filbert St in San F, one block is 31.5%

Tour de France categories - based on distance + slope, not just slope.
Most of the HC (without category) climbs in the three european tours
are about 15km long with an average slope barely more than 10%; however
parts of the route (especially towards the end) can get upto 15% which
can be killing (e.g. Mont Ventoux).

Many roads in the Himalayas have long climbs of 10% for 10-20km or
longer.  Many famous climbs (e.g. the Gata loops in Leh-Manali route)
are actually under 10% for most of the route.  It is the badly built
roads and temporary roads that are much harder.
How does a bicycle balance
[having said all this about cycling science, it turns out that one
isn't really sure of how a cycle balances! ]

The following text is based on the 3d edition

---
One word answer : unknown.

This seems completely perverse, but here's what David Wilson has to say:

	Like walking on stilts, balancing a bicycle derives from an ability
	to steer the support points to a position under the center of
	mass. Many bicycles are capable of making the necessary steering
	adjustments automatically, without any rider input.  Unfortunately,
	the mathematics purporting to describe bicycle motion and
	self-stability are difficult and have not been validated
	experimentally, so design guidance remains highly empirical.

The most visible "mystery" in balancing a bicycle is that the bicycle
can be balanced on just two points of support. Indeed, there's a sensation
that it would be impossible to fall down even if one tried.

Balancing a broomstick, or a bicycle, consists in making the small support
motions necessary to counter each fall as soon as it starts, by accelerating
the base horizontally in the direction in which it is leaning, enough so that
the acceleration reaction (the tendency of the center of mass to get left
behind) overcomes the tipping effect of unbalance.
The base must be accelerated with proper timing to ensure that the rate of
tipping vanishes just when the balanced condition is reached. Even more
sophisticated control is needed to maintain balance near a specified
position, or while moving along a specified path. Taller broomsticks fall
less quickly than shorter ones (the time it takes an object to fall is
proportional to [YCM/g] 1/2, where YCM is the height of the COM above the
support) and so are easier to balance. 4

Surprisingly, the small steering motions necessary to right a bicycle
after a disturbance can take place automatically, even with no rider,
as can be demonstrated by releasing a riderless bicycle to roll down a
gentle hill and then bumping it. 6
Gyroscopic effect of wheels?
Does the angular (gyroscopic) momentum of a bicycle's spinning wheels
somehow support it in the manner of a spinning top?

This belief is absolutely untrue. Gyroscopes can react against (i.e.,
resist) a tipping torque only by continuously changing heading. For
example, a tilted top can resist falling only by continuously
reorienting its spin axis around an imaginary cone. Locked steering on
a forward-rolling bicycle does not permit any wheel reorientation,
and the bicycle will fall over exactly like a bicycle at rest, no
matter how fast it travels, or how much mass is in the wheels. To be
sure, bicycle wheels actually are changing heading continuously
whenever the steering is turned, but their mass is too small to be of
importance: the resulting gyroscopic support moment is tiny compared to
the "mass times acceleration times center of mass height" moment that
predominantly governs bicycle balancing.

Still, there is an extremely interesting gyroscopic aspect to bicycle
balance: the angular momentum of a bicycle's front wheel urges it to steer
(i.e., to precess) toward the side on which the bicycle leans, as can be
demonstrated by lifting a bicycle off the ground, spinning the front wheel,
and briefly tilting the frame. In other words, the gyroscopic action of the
front wheel is one part of a system that automatically assists the rider in
balancing the bicycle. If the angular momentum of this gyroscopic action is
canceled (as Jones [1970] did with an additional, counter-rotating, front
wheel), considerably more skill and effort are needed for no-hands riding.
Countersteering to generate lean
An unstable balanced object like a broomstick or bicycle must have the
appropriate (say) leftward lean to maintain significant acceleration leftward
of the center of mass. In other words, the support point must first move to
the right of the system center of mass to create the lean. The motion of the
support point can be hard to observe while riding, because it happens so
quickly and unconsciously. To see it most clearly, one can ride a bicycle
along a painted line on the right edge of a road and watch the front wheel's
position while making a quick maneuver to change lanes rightward. One will
notice a brief leftward deviation of the front wheel's path, caused by
briefly steering leftward before settling into a sustained rightward steer
angle.
Also see
@article{sharp-08_stability-stability-and-control-of-bicycle,
  title={On the stability and control of the bicycle},
  author={Sharp, Robin S},
  journal={Applied mechanics reviews},
  volume={61},
  number={6},
  pages={060803},
  year={2008},
  publisher={American Society of Mechanical Engineers},
  annote = {

Toward the end of the 1890s, the bicycle in its modern form, with roughly
equal-sized wheels, an inclined steering joint, and pneumatic tires, was
established. Interest in bicycle dynamics led to the French Academy of Sciences
biennial Prix Fourneyron competition in 1897 having as its objective the
establishment of a theory of movement and the determination of the conditions
of stability of a bicycle. A flurry of activity followed and the papers
entered for the prize were time-marked by the process. Bourlet won the prize
and Carvallo shared second place [1]. The Bourlet and Carvallo prize
entries were published in 1899 [2,3]. Independently, Whipple studied the
bicycle stability problem in Cambridge [5].

[1] Meijaard, J. P., Papadopoulos, J. M., Ruina, A., and Schwab, A. L., 2007,
    “Linearized Dynamics Equations for the Balance and Steer of a Bicycle: A
    Benchmark and Review,” Proc. R. Soc. London, Ser. A, 463, pp. 1955–1982.
[2] Bourlet, C., 1899, “Étude Théoretique sur la Bicyclette,”
    Bull. Soc. Math. France, 27, pp. 47–67 and 76–96.
[3] Carvallo, M. E., 1899, Théorie du Mouvement du Monocycle et de la
    Bicyclette, Gauthier-Villars, Paris, France.
[4] Limebeer, D. J. N., and Sharp, R. S., 2006, “Bicycles, Motorcycles and
    Models: Single-Track Vehicle Modeling and Control,” IEEE Control
    Syst. Mag., 26(5), pp. 34–61.
[5] Whipple, F. J. W., 1899, “The Stability of the Motion of a Bicycle,”
    Q. J. Pure Appl. Math., 30(120). 312–321.

According to the results of a long-running and meticulous study reported
fully only recently [1], the linear analyses for small perturbations from
straight-running of Carvallo and Whipple are of good quality and almost
equivalent, with Carvallo simplifying the problem, perhaps needlessly, by
neglecting the mass of the steering frame in comparison with that of the
front wheel. Both authors were able to account for the self-stability of the
bicycle in a restricted speed range, which accorded with practical
experience.  Whipple’s model has become the basis for a benchmark bicycle, to
be specified and developed subsequently.

These analyses of the bicycle pre-date corresponding and better-known
analyses of the dynamics of other vehicles, automobiles, rail-cars, and
aircraft.

Both Carvallo and Whipple modeled the bicycle as consisting of four rigid
bodies, a main frame including the rider, a front frame pin-jointed to the
main frame, and two axisymmetric wheels, each with a spin freedom. The thin
tires were assumed to make point-contact with the ground and to roll without
any slip.  Small perturbations from straight-running were assumed, allowing a
description by linear constant-coefficient equations of motion.  This is the
“benchmark bicycle.”

The symbolic equations of general motion of the benchmark
bicycle are complicated and many papers containing significantly
incorrect accounts of them have been published 1. However,
recent research has established the accuracy of the Carvallo and
Whipple treatments and allowed the construction of a definitive
and easily comprehensible set of such equations, fully checked for
accuracy. Parameter sets have also been devised to provide a
benchmark for bicycle dynamics at the level so far discussed.
Some confirmatory experiments on the motions of an uncontrolled
"riderless" bicycle in the 3–6 m/s speed range have also been
reported [6].


}}
to contribute some excerpts from your favourite book to
book
excerptise. send us a plain text file with
page-numbered extracts from your favourite book. You can preface your
extracts with a short review.
email to (bookexcerptise [at] gmail [dot] com).
We reply to all feedback!
bookexcerptise is maintained by a small group of editors. get in touch with us! bookexcerptise [at] gmail [dot] .com. This article last updated on : 2015 Jan 19